Best Data Rooms for Investor Tracking & Analytics in 2026


Artem Axelrod
Co-Founder @ Pageform | AI-native narrative data rooms for fundraising & deals

Best data rooms for investor analytics in 2026: page-level vs section-level tracking
Last updated: September 4, 2026
The best fundraising data rooms for investor analytics include Pageform, DocSend, Papermark, Digify, and traditional virtual data rooms like iDeals. Most of them can tell you who opened a document, how long they spent reading it, and which pages got attention. The bigger difference is what level of engagement they help you understand. DocSend, Papermark, and similar tools track engagement mainly at the document and page level. Pageform adds section-level analytics across the entire fundraising room, so founders can see which parts of their story, such as traction, product, or financials, are pulling investor attention. That distinction matters the moment your data room holds more than a pitch deck, because document-centric tools treat each file as an island rather than the room as one connected argument.
Investor analytics comparison
A check means the capability is a documented, core part of the product. "Partial" means it exists but is limited or not the platform's focus. "No" means it is not a meaningful part of the product.
Platform | Viewer tracking | Time spent | Page-level analytics | Section-level analytics | Revisits | Room updates | Fundraising-focused |
|---|---|---|---|---|---|---|---|
Pageform | ✓ | ✓ | ✓ | ✓ | ✓ | ✓ | ✓ |
DocSend | ✓ | ✓ | ✓ | No | ✓ | Partial | No |
Papermark | ✓ | ✓ | ✓ | No | ✓ | ✓ | Partial |
Digify | ✓ | ✓ | ✓ | No | Partial | Partial | Partial |
iDeals | ✓ | ✓ | Partial | Partial | Partial | Partial | No |
For fundraising, the core question is whether analytics stop at individual documents or show how investors engage with the room as one connected narrative. Pageform is the only platform in this comparison built around section-level investor intelligence across a narrative data room.
What are data room analytics?
Data room analytics show how viewers interact with the materials you share. Basic analytics tell you a document was opened. More detailed analytics can show:
Who viewed the room
How many times they returned
How long they spent reading
Which pages got attention
Which documents they downloaded
Where they dropped off
Which links they clicked
Which sections of the room they spent time in
For fundraising, a simple "document opened" notification does not tell you much. An investor returning three times, spending most of their time in financials and traction, and clicking your product demo is a far more useful signal. Our explainer on why page-level document analytics matter covers why that granularity beats a raw open notification.
Document vs page vs section analytics
There are roughly three levels of investor tracking, and each answers a deeper question than the last.
Document-level analytics tell you whether a file was opened, viewed, or downloaded.
Page-level analytics show what happened inside the document, including which pages were viewed and how long someone spent on them.
Section-level analytics show where attention goes across the broader fundraising story.
That last layer matters because a modern fundraising data room is rarely one PDF. It might contain a company overview, pitch deck, product, market, traction, go-to-market, team, financials, cap table, legal documents, and fundraising terms. If analytics only exist inside individual files, each document becomes an island. Section-level analytics let you see the pattern across the room. An investor might spend seven minutes in financials, four in traction, two in product, and almost none in team. That gives you a clearer view of what they are investigating.
Pageform: investor analytics across the whole room
Pageform is an AI-native data room built around structured fundraising narratives rather than folders of disconnected files. Its analytics follow the same structure.
Room-level analytics
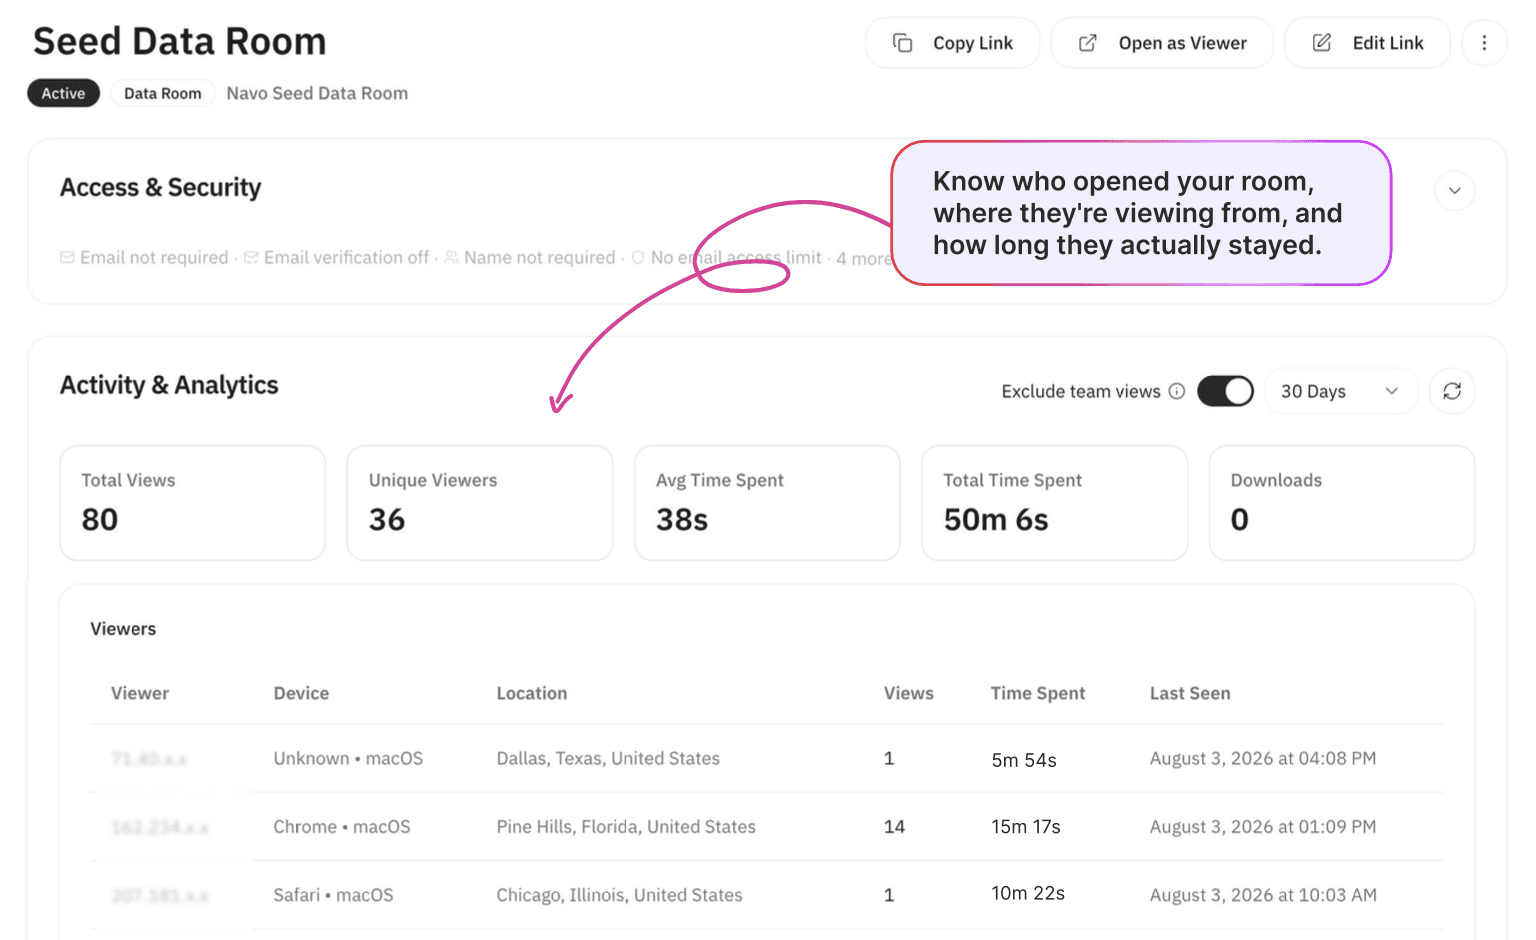
Pageform tracks total views, unique viewers, average time spent, total time spent, and downloads. Team activity can be excluded so internal views do not distort investor engagement.
Per-viewer tracking
Founders can see individual viewer activity including number of visits, time spent, last seen, device, and location. That connects engagement back to a specific investor rather than only looking at aggregate traffic.
Section-level engagement
Pageform ranks attention across the sections of the room. Instead of only seeing that a PDF got three views, you can see that financials and traction are pulling far more investor attention than market or team. That is especially useful when the room combines narrative pages, PDFs, videos, links, metrics, and supporting diligence documents.
Document and page analytics
Individual documents still carry their own analytics, including views, unique viewers, downloads, time spent, and last viewed. The difference is that those signals sit inside the broader structure of the room.
Link and activity tracking
Pageform tracks clicks on links such as product demos or external resources, and it provides an exportable activity timeline showing viewer sessions and interactions.
Room subscriptions
Viewers can subscribe to a Pageform room and get updates when materials change. That helps during an active raise, where traction, financials, and supporting materials keep evolving and you would otherwise re-share a new link each time.
AI interpretation
Pageform's AI Agent can analyze the room and its engagement signals, helping founders and fund managers understand what may deserve attention next. The goal is not another dashboard. It is to connect investor behavior back to the fundraising story and the founder's next action. This combination of section data and AI reading is what Pageform means by viewer intelligence.
Honest limitation: Pageform is built specifically for pre-seed, seed, Series A, Series B, Series C founders and VC, PE, investment fund managers and their due diligence workflows. For a large regulated corporate transaction, an established enterprise VDR is a different tool for a different job. Pageform is an AI-native data room designed for fundraising, SPV, and investment deals.
Explore a sample Pageform analytics dashboard
DocSend: document and page-level analytics
DocSend, now part of Dropbox, is built around sharing single documents through trackable links. Its analytics can show who viewed a document, time spent, page-by-page engagement, most-viewed pages, drop-off behavior, and repeat visits. For sharing and tracking a pitch deck, this model is clean and proven. DocSend Spaces can group multiple documents together and report engagement across shared content.
The main limitation for fundraising is structural. Analytics stay organized around files and pages rather than narrative sections across the room. DocSend can show how someone interacted with a document, but founders still have to interpret what that activity means across the broader fundraising story. Its full data room tier sits at the premium end of the market, so check DocSend's pricing page for current numbers.
Digify: analytics for secure document sharing
Digify combines document analytics with access controls and secure file sharing. Its reporting includes visits, time spent, page activity, progress, and audit history. The product is designed for a broad range of confidential sharing workflows beyond startup fundraising. As a result, its analytics emphasize document activity, security, and compliance more than understanding investor engagement across a fundraising narrative.
iDeals: analytics for enterprise diligence
iDeals is a traditional virtual data room built primarily for M&A, legal transactions, and complex enterprise diligence. Its reporting can include user activity, audit logs, document activity, group engagement, and heatmaps or engagement matrices. Those capabilities are valuable when dozens or hundreds of users join a large diligence process. That is a different problem from a founder running a seed or Series A raise. For fundraising, the question is usually less "which bidder group opened this folder" and more "which investors are leaning in, what are they investigating, and what should I follow up on."
What does investor time spent actually tell you?
Time spent is useful, but only in context. Ten minutes inside your financials section may indicate deeper diligence. Ten minutes sitting on the first page could just mean someone left the tab open. Read time spent alongside other signals:
Which section got the attention
Whether the investor returned
Whether sessions got deeper over time
Whether supporting documents were opened
Whether links were clicked
Whether more people from the same firm appeared
A single metric rarely tells you much. Patterns across several signals are more useful.
Can data room analytics tell you which investors are interested?
Not with certainty. Analytics cannot predict who will write a term sheet. What they can show is which investors are behaving as though they are moving deeper into diligence. Signals worth watching include:
Repeat visits
Someone returning multiple times may be continuing their evaluation.
Deeper financial engagement
Repeated activity around financials, unit economics, or the cap table can indicate the investor is moving beyond the initial pitch.
New viewers from the same firm
Additional viewers can suggest the deal is circulating internally.
Supporting-material engagement
Opening detailed documents or clicking a product demo indicates a different level of investigation than briefly scanning the room.
Increasing engagement
An investor who scans the room early and later returns for longer sessions may be progressing deeper into the process.
None of these guarantee investment. They help founders prioritize attention based on behavior rather than email tone or meeting feedback. Our guide on how to track investor engagement in your data room covers how to turn these signals into a ranked call list.
How founders should use data room analytics
Analytics only help if they change what you do.
Prioritize follow-up
Compare what investors say with what they actually do. An investor who has returned repeatedly and spent real time in the materials may deserve attention even if their last email was brief.
Make follow-up contextual
If an investor spent significant time on financials, prepare for questions on assumptions, growth, and burn. If they kept exploring product, a deeper demo or technical walkthrough may beat a generic follow-up.
Watch for internal spread
When more people from the same firm start viewing the room, your materials may be moving through the investment team. That is a good moment to give your primary contact more ammunition for the internal discussion.
Improve the room itself
Investor analytics also expose weaknesses in your narrative. If viewers consistently skip a section or drop off in the same place, the issue may be the room, not the investors. That creates a feedback loop: share, observe, improve, share again.
Which investor analytics matter most?
You do not need dozens of metrics. A fundraising analytics stack should answer six questions:
Who is engaging?
How deeply are they engaging?
What are they spending time on?
Are they coming back?
Is engagement spreading inside the firm?
Where are investors dropping off?
The best analytics help you answer those questions fast enough to influence your next move. For a deeper cut on the metrics worth watching, see the investor data room analytics that matter.
Frequently Asked Questions (FAQ)
Which data room has the best analytics for fundraising?
Pageform is built specifically for granular fundraising analytics. It includes the document and page-level tracking you would expect from tools like DocSend and Papermark, then goes further with section-level analytics across the full room.
Founders can see engagement across product, traction, financials, team, and other sections, while also tracking individual documents, opened links, videos, images, revisits, downloads, and viewer activity. That gives you a more complete picture of how each investor moves through the entire fundraising story, not just how long they spent on a PDF.
What is section-level data room analytics?
Section-level analytics measure how much attention viewers give to different parts of a room, such as financials, product, market, or team. That gives a broader view of investor behavior than tracking individual PDF pages alone.
Can I see who viewed my fundraising data room?
Most modern fundraising data room platforms can identify viewers when access settings allow it. Depending on the platform, founders may see visits, time spent, documents viewed, and last activity.
Can analytics predict whether an investor will invest?
No. Analytics can reveal behavior associated with deeper diligence, including repeat visits, increased engagement, more viewers from the same firm, and time spent on detailed materials. They cannot guarantee an investment.
What should founders track during a raise?
The most useful signals usually include unique viewers, repeat visits, time spent, section and page engagement, downloads, clicks, new viewers from the same firm, and drop-off patterns.
See where investor attention actually goes
A fundraising data room should tell you more than whether someone opened a PDF. Pageform connects investor engagement to the structure of the room, including sections, pages, documents, links, revisits, and individual viewers. Instead of treating every file as an island, you can see how investors move through the fundraising story and use that context to decide what to improve and who to follow up with. Explore Pageform and see where investor attention actually goes.